Close Menu

    Subscribe to Updates

    Get the latest creative news from Slice about art, design and business.

    What's Hot

    Monday.com Stock Soars as AI Offerings Power Q4 Results

    February 10, 2025

    Hyatt Bets on Growth of All-Inclusives With $2.6B Playa Hotels Acquisition

    February 10, 2025

    Inside Coors Light’s Super Bowl campaign: CMO explains its formula to stand out

    February 10, 2025
    Facebook X (Twitter) Instagram
    Facebook X (Twitter) Instagram
    Slice'd News
    Subscribe
    • Home
    • World News
    • Business News
    • Finanical News
    • Contact
    Slice'd News
    Home»Business News»One map shows how expensive it is to live across the country
    Business News

    One map shows how expensive it is to live across the country

    VoidBy VoidDecember 13, 2024No Comments2 Mins Read
    Facebook Twitter Pinterest LinkedIn Tumblr Email
    Share
    Facebook Twitter LinkedIn Pinterest Email
    California had the highest regional price parity last year, which suggests living there is expensive.

    Carmen Martínez Torrón/Getty Images

    • New regional price parity data showed the varying cost of living in the US.
    • California and Washington, DC, had the highest cost of living, largely driven by housing costs.
    • Most of the states with the lowest relative cost of living were around the middle of the country.

    Many states have a lower cost of living than the national average, but the West Coast and Northeast are still pricey.

    The Bureau of Economic Analysis published new regional price parity data on Thursday that showed how expensive it is to live in different areas of the US.

    “Regional price parities measure the differences in price levels across states for a given year and are expressed as a percentage of the overall national price level,” BEA said in a news release.

    The new 2023 data showed 16 states and Washington, DC, had more expensive goods and services than the national average. The states with the lowest cost of living were mainly around the middle of the country, including some states in the South.

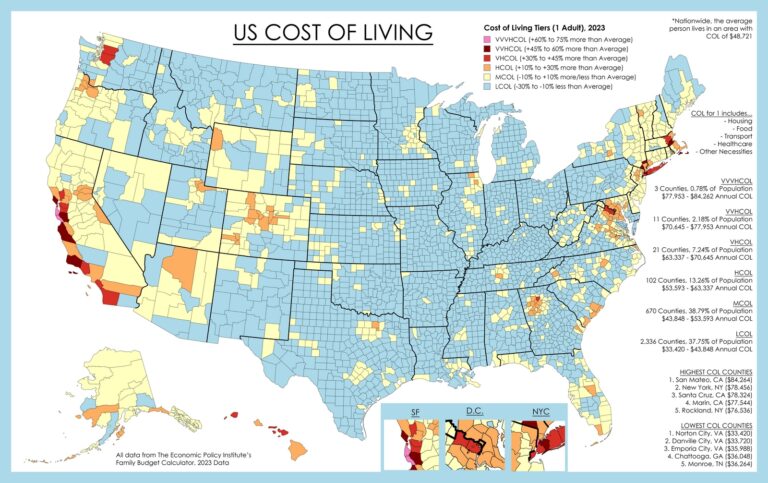
    The following map shows overall regional price parities, where a value over 100 means it was above the national average. Hawaii’s figure of 108.6 means goods and services were about 9% more expensive than the average.

    California had the highest relative cost of living; the state is 12.6% more expensive than the average. California metros also made up the majority of the top 10 that had the highest all-items regional price parities in 2023. The metro area of San Francisco-Oakland-Berkeley had the highest at 118.2, meaning it was almost 20% more expensive than the national average.

    Washington, DC, had an ever-so-slightly higher figure than California in 2022 but fell short of California’s in 2023. DC was 10.8% more expensive than the average. New Jersey ranked right below DC.

    Relatively high housing costs contributed to the overall high regional price parities in those two states and DC. BEA said rents are usually “the main driver in differences in RPPs.” DC, California, and New Jersey had the highest regional price parities for rents.

    Arkansas continued to have the lowest regional price parity and was 13.5% less expensive than the national average in 2023. Alabama, West Virginia, and South Dakota were among the 10 states that were at least 10% less expensive than the national average.
    Read the original article on Business Insider
    Share. Facebook Twitter Pinterest LinkedIn Tumblr Email
    Void

    Related Posts

    Inside Coors Light’s Super Bowl campaign: CMO explains its formula to stand out

    February 10, 2025

    LinkedIn’s CISO and other executives break down how to get into the lucrative field of cybersecurity

    February 10, 2025

    I moved from Miami to a small town in Central Florida to save money. I love it so much that I’m still here 15 years later.

    February 10, 2025

    Comments are closed.

    Search the Void
    Recent News
    • Monday.com Stock Soars as AI Offerings Power Q4 Results February 10, 2025
    • Hyatt Bets on Growth of All-Inclusives With $2.6B Playa Hotels Acquisition February 10, 2025
    • Inside Coors Light’s Super Bowl campaign: CMO explains its formula to stand out
      February 10, 2025
    Our Picks
    Stay In Touch
    • Facebook
    • Twitter
    • Instagram
    Don't Miss

    Monday.com Stock Soars as AI Offerings Power Q4 Results

    Finanical News February 10, 20251 Min Read

    TradingView

    Hyatt Bets on Growth of All-Inclusives With $2.6B Playa Hotels Acquisition

    February 10, 2025

    Inside Coors Light’s Super Bowl campaign: CMO explains its formula to stand out

    February 10, 2025

    LinkedIn’s CISO and other executives break down how to get into the lucrative field of cybersecurity

    February 10, 2025

    Subscribe to Updates

    Get the latest news from Void!

    News, Sliced for you

    News, beautifully simple.

    Stay informed with the stories that matter. Slice brings you the latest updates with clarity and ease, so you can explore the world without the clutter. From global events to tech innovations, our news is designed for a seamless reading experience—one Slice at a time.

    Discover news that feels effortless with Slice.

    Our Picks

    Monday.com Stock Soars as AI Offerings Power Q4 Results

    February 10, 2025

    Hyatt Bets on Growth of All-Inclusives With $2.6B Playa Hotels Acquisition

    February 10, 2025

    Nokia Names Intel’s AI, Data Center Head as New CEO

    February 10, 2025
    1 2 3 … 44 Next
    Search for a Slice
    Facebook X (Twitter) Instagram Pinterest
    • Home
    • World News
    • Business News
    • Finanical News
    • Privacy Policy
    © Copyright Sliced Inc 2021 - 2024. All Rights Reserved!

    Type above and press Enter to search. Press Esc to cancel.